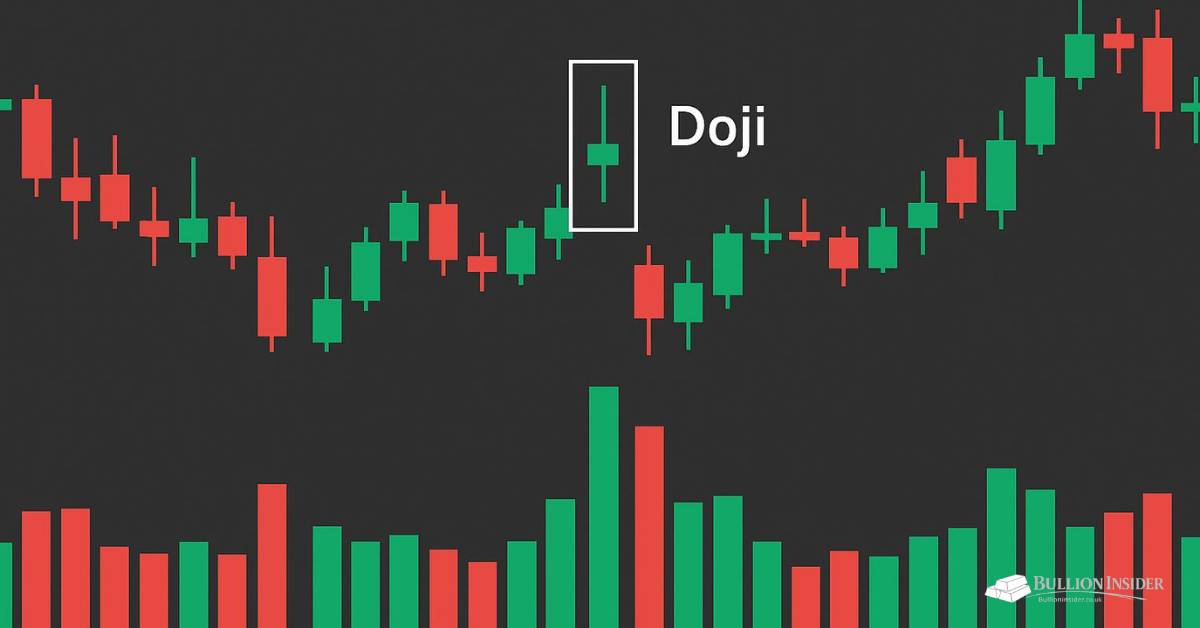
The doji candle is one of the most widely recognized patterns in technical analysis and is used by traders across stocks, forex, cryptocurrencies, commodities, futures, and other financial markets. Despite its simple appearance, this candlestick carries valuable information because it reflects a moment when buying and selling pressure are almost perfectly balanced. Rather than showing a clear victory for buyers or sellers, it signals hesitation in the market.
For beginners, a doji candle often serves as an early indication that a strong trend may be slowing down or losing momentum. For experienced traders, it becomes an important clue that deserves further analysis before making a trading decision. However, the pattern should never be viewed as a guaranteed buy or sell signal. Like all candlestick patterns, its meaning depends on the overall market context, including the prevailing trend, support and resistance levels, trading volume, and confirmation from the candles that follow.
Understanding how a doji candle forms, what it represents, and how traders use it alongside other technical tools can help you interpret price charts with greater confidence and make more informed trading decisions.
What Is a Doji Candle?
A doji candle is a Japanese candlestick pattern in which the opening and closing prices are identical or extremely close during a specific trading period. Because there is very little difference between these two prices, the candle forms with a tiny body while its upper and lower shadows may vary in length depending on how prices moved throughout the session.
This pattern represents market indecision. During the trading period, buyers may push prices higher while sellers drive them lower, yet neither side manages to maintain control by the time the market closes. The result is a candle that reflects an almost equal balance between buying and selling pressure.
Although many traders associate a doji candle with potential trend reversals, it can also appear before trend continuation or during periods of market consolidation. For this reason, professional traders rarely rely on the pattern alone and instead wait for additional confirmation before taking action.
The History Behind Japanese Candlestick Patterns
Japanese candlestick analysis originated in eighteenth-century Japan, where rice merchants developed techniques to understand price movements and market psychology. One of the earliest traders associated with these methods was Munehisa Homma, whose observations helped shape many of the concepts used in modern candlestick analysis.
Over the years, these techniques evolved into one of the world’s most popular methods of reading price action. Today, Japanese candlestick charts are used by traders and investors in nearly every financial market because they provide a quick visual representation of market sentiment.
Among all candlestick formations, the doji remains one of the most important because it clearly illustrates moments when supply and demand reach temporary equilibrium.
Why the Doji Candle Matters
Financial markets rarely move in straight lines. Even during strong bullish or bearish trends, there are moments when momentum slows and traders begin questioning the next direction of price.
A doji candle often appears during these transition periods. Instead of telling traders exactly what will happen next, it highlights that uncertainty has entered the market. Buyers and sellers are evenly matched, making the next few trading sessions especially important.
Its value comes from what it reveals about market psychology rather than the candle’s shape itself. A doji suggests that conviction is weakening, but whether the market reverses, continues, or moves sideways depends on how participants react afterward.
This is why experienced traders treat the doji as an early warning sign rather than a standalone trading signal.
Main Types of Doji Candles
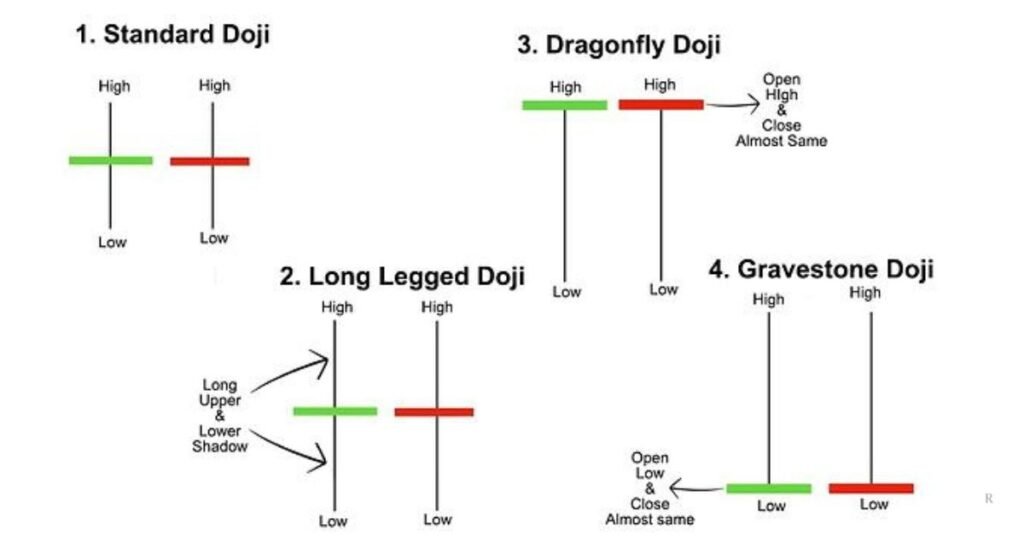
Several variations of the doji candle exist, and each provides slightly different information about market sentiment.
Standard Doji
The standard doji has a very small body with upper and lower shadows of moderate length. It simply reflects uncertainty, showing that buyers and sellers finished the trading session with nearly equal strength.
Long-Legged Doji
The long-legged doji has long upper and lower shadows with a tiny body near the center of the candle.
This pattern indicates that prices moved significantly higher and lower during the session before eventually closing close to where they opened. It reflects increased volatility and strong disagreement between buyers and sellers, often appearing during periods of heightened uncertainty.
Dragonfly Doji
A dragonfly doji forms with a long lower shadow and little or no upper shadow.
It develops when sellers push prices sharply lower during the session, but buyers gradually regain control and drive the price back near the opening level before the close.
When this pattern appears after a prolonged downtrend and near a significant support level, traders may view it as an early sign that selling pressure is weakening. However, confirmation from the following candle remains important before assuming a bullish reversal.
Gravestone Doji
A gravestone doji has a long upper shadow with little or no lower shadow.
In this case, buyers initially push prices much higher, but sellers eventually regain control and force the price back toward the opening level before the session ends.
After a sustained uptrend, this pattern may indicate that buying momentum is fading. Even so, traders generally wait for a bearish confirmation candle before considering a short position.
Four-Price Doji
The four-price doji is the rarest variation.
Its opening, closing, highest, and lowest prices are almost identical, producing a candle with virtually no visible body or shadows. This pattern usually appears in markets experiencing extremely low trading volume or very limited liquidity, making it less useful for forecasting future price movement.
How a Doji Candle Works
A doji candle forms because buying and selling pressure cancel each other out during a trading session.
Throughout the session, buyers may push prices upward while sellers respond by driving them back down. In some cases, prices fluctuate dramatically before eventually returning close to the opening level by the market’s close.
This outcome shows that neither side has established lasting control. Instead, the market enters a temporary state of balance where participants are uncertain about the next direction.
A doji does not automatically predict a reversal. Sometimes the existing trend resumes with even greater strength, while in other situations the market changes direction entirely. Because of this uncertainty, traders focus on what happens after the doji appears rather than reacting immediately.
How to Confirm a Doji Candle
One of the biggest mistakes beginners make is assuming that every doji candle signals a reversal. In reality, experienced traders wait for confirmation before entering a trade.
For a potential bullish setup, traders often look for:
- A strong bullish candle closing above the doji’s high.
- The doji forming near an important support level.
- Higher-than-average trading volume.
- Bullish confirmation from indicators such as the Relative Strength Index (RSI) or Moving Average Convergence Divergence (MACD).
For a potential bearish setup, traders typically look for:
- A bearish candle closing below the doji’s low.
- The doji appearing after a prolonged uptrend.
- Formation near a significant resistance level.
- Increasing selling volume or weakening momentum shown by technical indicators.
Waiting for confirmation helps reduce false signals and improves the overall quality of trading decisions.
Real Trading Example
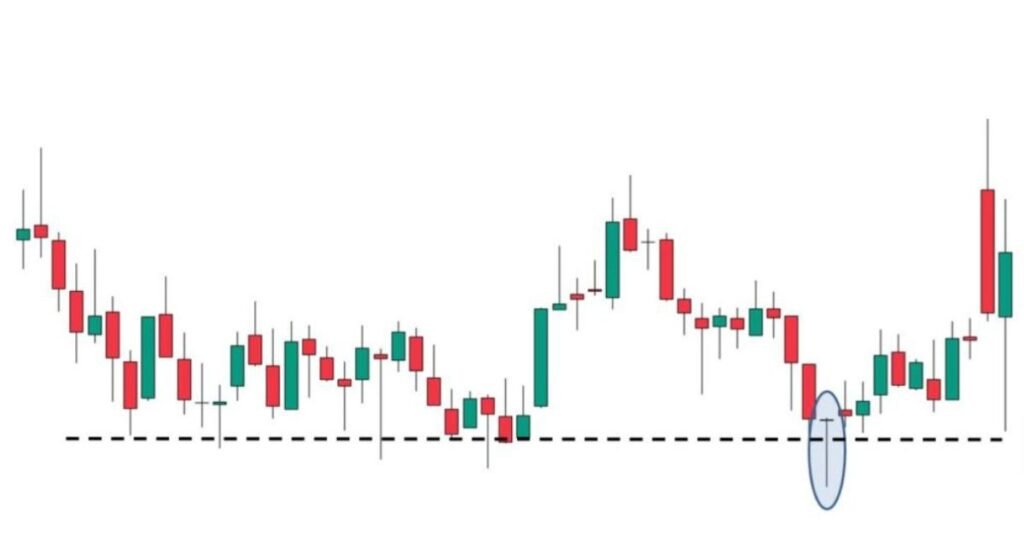
Imagine that Bitcoin has been falling steadily for several days before reaching a well-established support level. A Dragonfly Doji then forms on the daily chart, showing that buyers managed to recover almost all of the day’s losses before the market closed.
Instead of buying immediately after seeing the doji, many experienced traders would wait for additional confirmation. The following day, a strong bullish candle closes above the doji’s high while trading volume increases noticeably. At the same time, the RSI begins moving upward from oversold territory.
When several signals point in the same direction, traders generally have greater confidence that buying momentum may be returning. This example illustrates why a doji candle becomes far more meaningful when combined with price action, support levels, trading volume, and technical indicators rather than being used as a standalone signal.
Benefits of Using Doji Candles
Many traders include doji candles in their technical analysis because they are easy to identify and can provide valuable insight into changing market conditions. While the pattern is not a complete trading strategy on its own, it can serve as an early warning sign that market momentum may be shifting.
Some of the main advantages include:
- Easy for beginners to recognize and understand.
- Works across stocks, forex, cryptocurrencies, commodities, ETFs, and futures markets.
- Highlights periods of market indecision.
- Helps identify potential reversal or continuation zones.
- Complements support and resistance analysis.
- Can be combined with technical indicators for stronger confirmation.
- Encourages traders to wait for confirmation instead of making impulsive decisions.
When used alongside other forms of technical analysis, a doji candle becomes a valuable tool for understanding market sentiment rather than simply predicting price direction.
Limitations of Doji Candles
Although the doji candle is one of the most respected candlestick patterns, it also has important limitations.
A doji simply shows that buyers and sellers finished a trading session with nearly equal strength. It does not guarantee that prices will reverse, continue, or move in any specific direction.
During sideways or range-bound markets, doji candles appear frequently without leading to meaningful price movements. Acting on every doji can therefore result in unnecessary trades and false signals.
Market conditions also influence the pattern’s reliability. A doji that forms after a strong trend and near a significant support or resistance level generally carries more weight than one that appears in the middle of a quiet trading range.
Understanding these limitations helps traders avoid overestimating the importance of a single candlestick pattern.
Expert Tip: Professional traders rarely make trading decisions based on a doji candle alone. The pattern becomes significantly more reliable when it appears after a strong trend and is confirmed by the following candle, increased trading volume, nearby support or resistance levels, and other technical indicators.
Best Ways to Use a Doji Candle
The most effective way to use a doji candle is to analyze it within the context of the overall market rather than viewing it as an isolated signal.
Experienced traders typically consider several factors before entering a trade:
- The direction of the prevailing trend.
- Nearby support and resistance levels.
- Trading volume.
- Confirmation from the following candle.
- Market volatility.
- Technical indicators.
- Broader market news and sentiment.
Looking at several pieces of evidence together usually leads to more informed trading decisions than relying on any single candlestick pattern.
Using Technical Indicators with a Doji Candle
Technical indicators can significantly improve the interpretation of a doji candle by providing additional confirmation.
Some of the most commonly used indicators include:
Relative Strength Index (RSI)
The RSI helps identify overbought and oversold market conditions. A bullish doji appearing while the RSI is in oversold territory may strengthen the case for a potential upward reversal.
Moving Average Convergence Divergence (MACD)
The MACD measures changes in momentum. If the MACD begins producing a bullish crossover after a doji appears, traders may view it as additional confirmation.
Moving Averages
Moving averages help identify the overall market trend. A doji forming near an important moving average can sometimes indicate that the market is testing dynamic support or resistance.
Bollinger Bands
Bollinger Bands measure market volatility. A doji forming near the upper or lower band may suggest that price momentum is slowing and deserves closer attention.
Fibonacci Retracement
Fibonacci retracement levels are commonly used to identify potential support and resistance zones. When a doji forms near one of these levels, traders often monitor the next few candles for confirmation.
Using multiple indicators together does not eliminate risk, but it can improve the quality of technical analysis by providing additional evidence before entering a trade.
The Role of Trading Volume
Trading volume often plays an important role when interpreting a doji candle.
A doji that forms with higher-than-average trading volume may carry greater significance because it reflects strong participation from both buyers and sellers. Even though neither side ultimately gained control, the increased activity suggests that the market is paying close attention to that price level.
On the other hand, a doji that develops during very low trading volume may simply reflect temporary inactivity rather than a meaningful change in market sentiment.
For this reason, many traders evaluate volume alongside candlestick patterns instead of relying solely on price action.
Risk Management When Trading Doji Candles
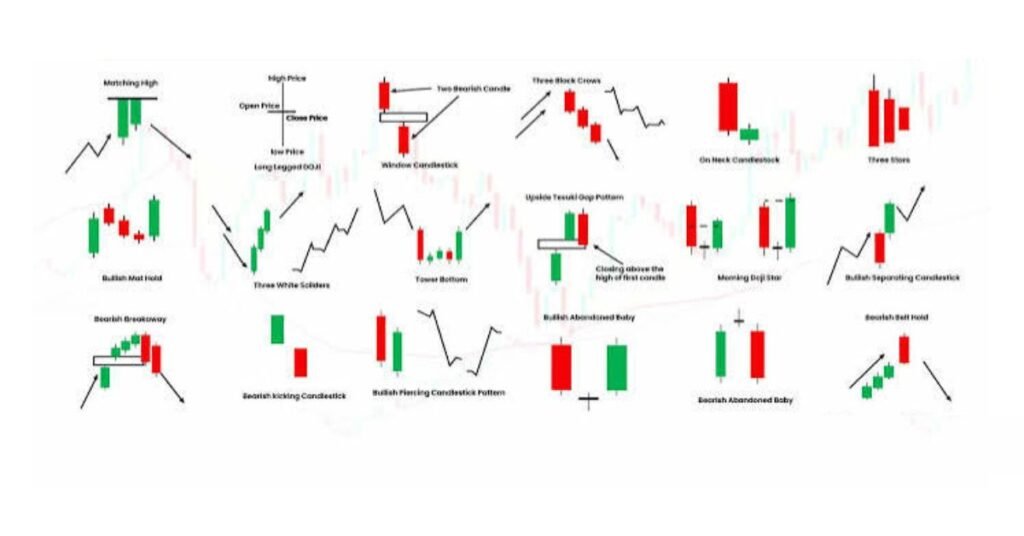
Even the strongest candlestick patterns can fail, making risk management an essential part of every trading strategy.
Many experienced traders use stop-loss orders below support for bullish trades or above resistance for bearish trades. They also avoid risking a large percentage of their trading capital on a single position and aim for favorable risk-to-reward ratios before entering the market.
Other common risk management practices include:
- Never entering a trade without confirmation.
- Using appropriate position sizing.
- Avoiding emotional trading decisions.
- Following a written trading plan.
- Accepting small losses instead of allowing them to become much larger.
Good risk management cannot guarantee profitable trades, but it helps protect trading capital over the long term and reduces the impact of inevitable losing trades.
Common Mistakes Traders Make
Many beginners misunderstand the significance of a doji candle by assuming it automatically signals a market reversal.
Some of the most common mistakes include:
- Entering trades before confirmation.
- Ignoring the overall market trend.
- Trading without stop-loss orders.
- Relying solely on candlestick patterns.
- Ignoring support and resistance levels.
- Overlooking trading volume.
- Risking too much capital on a single trade.
Recognizing these mistakes can help traders develop better habits and improve consistency over time.
Doji Candle Compared with Other Candlestick Patterns
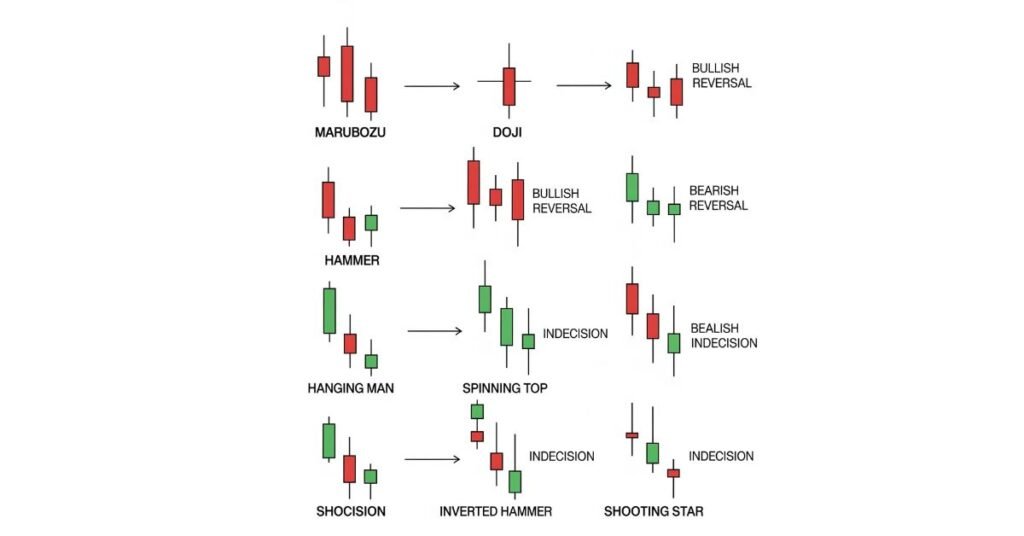
Although the doji candle is one of the best-known candlestick patterns, it differs from several other formations that traders frequently encounter.
A spinning top also reflects market indecision but has a slightly larger real body than a doji.
A hammer features a small body with a long lower shadow and is generally viewed as a bullish reversal pattern after a downtrend.
A shooting star has a long upper shadow with a small body and often signals weakening buying momentum following an uptrend.
Understanding these differences helps traders interpret price action more accurately.
| Candlestick Pattern | Primary Meaning | Common Market Signal |
| Doji | Market indecision | Possible reversal or continuation |
| Spinning Top | Mild indecision | Consolidation |
| Hammer | Bullish rejection | Potential bullish reversal |
| Shooting Star | Bearish rejection | Potential bearish reversal |
Where Doji Candles Are Used
One of the biggest strengths of the doji candle is its versatility. Because it reflects market psychology rather than a specific asset, the pattern appears across almost every actively traded financial market.
Common examples include:
- Stock markets
- Forex trading
- Cryptocurrency exchanges
- Commodity markets
- Exchange-traded funds (ETFs)
- Market indices
- Futures contracts
Regardless of the market, traders interpret the pattern using the same core principles: trend analysis, confirmation, trading volume, and overall market context.
Conclusion
The doji candle remains one of the most valuable and widely recognized candlestick patterns because it highlights moments when buyers and sellers reach temporary equilibrium. Rather than predicting the market’s next move on its own, the pattern provides insight into changing momentum and trader sentiment.
Its greatest value comes from being used alongside trend analysis, support and resistance levels, trading volume, technical indicators, and disciplined risk management. Waiting for confirmation instead of reacting immediately can help traders reduce false signals and make more informed decisions.
Whether you trade stocks, forex, cryptocurrencies, commodities, ETFs, or futures, understanding how to interpret a doji candle within the broader market context can improve your chart-reading skills and strengthen your overall trading strategy. Like any technical analysis tool, the doji works best as one piece of a well-rounded decision-making process rather than as a standalone trading signal.
Building trading skills takes time, and understanding candlestick patterns is only one part of becoming a successful trader. You can continue learning through our complete collection of trading education guides. Beginner’s Guide to Trading and Technical Analysis
FAQs
What does a doji candle indicate?
A doji candle generally indicates market indecision, where buyers and sellers finish the trading session with nearly equal strength. It reflects hesitation in the market rather than a guaranteed change in price direction.
Is a doji candle bullish or bearish?
By itself, a doji candle is neither bullish nor bearish. Its interpretation depends on the prevailing trend, where it forms on the chart, and whether the following candles confirm a potential reversal or continuation.
Can a doji candle predict a trend reversal?
Not on its own. A doji may suggest that momentum is weakening, but traders usually wait for confirmation from subsequent price action, trading volume, and technical indicators before making trading decisions.
Which markets use doji candle analysis?
Doji candles are widely used in stocks, forex, cryptocurrencies, commodities, exchange-traded funds (ETFs), market indices, and futures markets because the pattern reflects general market psychology.
Should beginners rely only on a doji candle?
No. Beginners should combine the doji with trend analysis, support and resistance levels, trading volume, technical indicators, and proper risk management. Using multiple forms of confirmation generally leads to more reliable trading decisions.
Is a doji candle reliable on its own?
No. Most professional traders consider a doji candle to be a warning sign rather than a complete trading signal. It becomes much more reliable when confirmed by the following candle, increased trading volume, key support or resistance levels, and other technical indicators.