
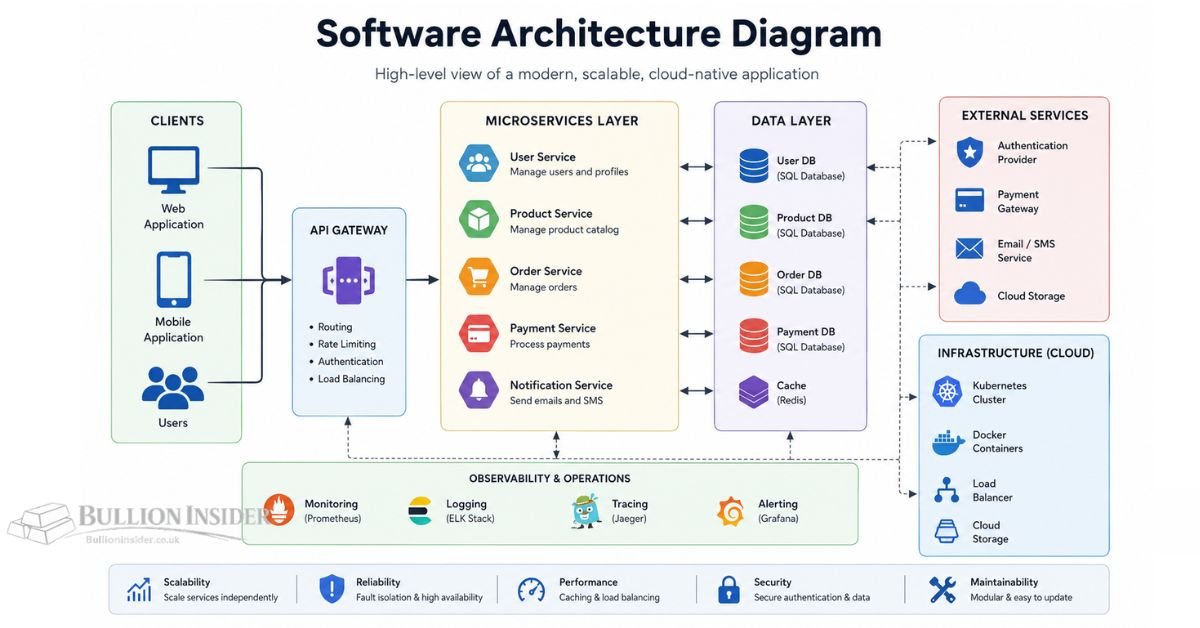
A software project can have clean, efficient code and still become difficult to maintain if nobody understands how its pieces fit together. That’s where a software architecture diagram proves its value. It gives developers, architects, project managers, and even non-technical stakeholders a shared view of the system before they dive into implementation details.
Instead of explaining an application through pages of documentation, a well-designed diagram shows the major building blocks, how they communicate, and where data flows. It answers questions such as: Where does user authentication happen? Which service talks to the database? How do external APIs fit into the system? Those answers make planning, troubleshooting, scaling, and onboarding much easier.
As software systems increasingly rely on cloud platforms, containers, APIs, and distributed services, architecture diagrams have become a standard part of technical documentation. They help teams make informed design decisions, reduce misunderstandings, and keep complex systems manageable as they evolve.
If you’re learning software architecture, documenting an existing application, or planning a new project, understanding how architecture diagrams work is an essential skill.
Quick Answer
A software architecture diagram is a visual representation of a software system that shows its major components, their relationships, and how information moves between them. It focuses on the overall design rather than programming details, making it easier to plan, build, maintain, and communicate complex software systems.
Key Takeaways
- A software architecture diagram provides a high-level view of how a software system is structured.
- It improves communication between developers, architects, managers, and stakeholders.
- Different diagram types serve different purposes, from system overviews to deployment planning.
- Modern diagrams often document cloud-native applications, Kubernetes deployments, microservices, and APIs.
- Keeping architecture diagrams updated is just as important as creating them.
What Is a Software Architecture Diagram?
A software architecture diagram is a visual blueprint that illustrates how the major parts of a software application work together. Rather than describing every class, method, or line of code, it focuses on the system’s overall structure, showing key components, services, databases, users, and the connections between them.
Think of it as the architectural blueprint of a building. Before construction begins, architects create drawings that show the layout, structural elements, and how different spaces connect. Software architecture diagrams serve a similar purpose by helping teams understand the design of an application before or alongside development.
The level of detail varies depending on the audience. An executive might only need a high-level system overview, while developers may require a component-level diagram to understand how individual services interact. For this reason, organizations often maintain several architecture diagrams, each designed for a specific purpose.
Unlike flowcharts that describe a sequence of actions or UML diagrams that often focus on implementation details, software architecture diagrams emphasize how the system is organized and how its major parts collaborate.
Why Software Architecture Matters
As applications grow, they rarely remain a single codebase running on one server. A typical modern application may include web front ends, mobile apps, APIs, authentication services, databases, caching layers, cloud storage, monitoring tools, third-party integrations, and background processing services. Without a clear architectural view, understanding how these pieces interact quickly becomes challenging.
A software architecture diagram reduces that complexity by presenting the system in a way that’s easy to interpret. It helps teams discuss design decisions, identify dependencies, and spot potential issues before they become expensive to fix.
Architecture diagrams are also valuable throughout the software lifecycle—not just during initial design. They support planning, development, testing, deployment, maintenance, and future enhancements. When documentation accurately reflects the current system, teams spend less time rediscovering how things work and more time delivering improvements.
For organizations managing multiple applications, consistent architecture documentation also promotes standardization and simplifies collaboration across teams.
Why a Software Architecture Diagram Is Important
A software architecture diagram isn’t just documentation—it’s a practical tool that supports better decision-making throughout a project’s lifecycle.
Improves Team Communication
Developers, architects, QA engineers, DevOps specialists, and business stakeholders often have different perspectives on the same project. An architecture diagram provides a shared reference point, reducing misunderstandings and making technical discussions more productive.
Simplifies Complex Systems
Large applications can contain dozens or even hundreds of interconnected services. A diagram organizes those relationships into a format that’s easier to understand than reading source code or lengthy documentation.
Speeds Up Onboarding
New team members can become productive much faster when they have access to accurate architecture diagrams. Instead of piecing together the system from code repositories, they can understand the application’s structure in a fraction of the time.
Supports Better Design Decisions
Visualizing the architecture makes it easier to evaluate scalability, security, performance, and integration choices before implementation begins. Small design improvements made early often prevent larger problems later.
Improves Maintenance and Troubleshooting
When issues arise, teams can use architecture diagrams to identify affected components, trace dependencies, and understand how changes may impact other parts of the system.
Helps with Compliance and Security Reviews
Many industries require documented system architecture during audits or security assessments. Clear diagrams help reviewers understand data flows, trust boundaries, and integration points without analyzing the entire codebase.
Real-World Example
Imagine an online shopping platform.
Instead of showing thousands of files and functions, an architecture diagram might illustrate the following flow:
- A customer browses products through a web or mobile application.
- Requests are routed through an API gateway.
- Authentication verifies the user’s identity.
- Product information is retrieved from a catalog service.
- Inventory is checked through a separate inventory service.
- Payment requests are securely processed by an external payment provider.
- Order details are stored in a database.
- A notification service sends confirmation emails or text messages.
Even someone unfamiliar with the application’s code can quickly understand how the system operates by looking at this high-level view.
Expert Tip: A useful architecture diagram answers common questions at a glance. If readers need additional documentation just to understand the diagram itself, it likely contains too much detail.
Main Components of a Software Architecture Diagram
Although every software system is unique, most architecture diagrams include a common set of building blocks. Understanding these components makes it easier to read or create diagrams for different types of applications.
| Component | Purpose |
| Users | People or external systems interacting with the application. |
| User Interface | Web, mobile, or desktop application used to access the system. |
| API Gateway | Routes requests to the appropriate backend services and often handles authentication or rate limiting. |
| Backend Services | Process business logic and coordinate communication between system components. |
| Databases | Store application data, user information, transactions, and business records. |
| Authentication Service | Verifies user identity and controls access to protected resources. |
| Cache | Improves performance by temporarily storing frequently requested data. |
| Message Queue | Enables asynchronous communication between services. |
| External APIs | Connect the application with third-party services such as payment gateways, mapping platforms, or messaging providers. |
| Monitoring and Logging | Collect operational data to help detect performance issues, errors, and security events. |
Modern cloud-native applications may also include:
- Kubernetes clusters
- Docker containers
- Service meshes
- Content Delivery Networks (CDNs)
- Object storage
- Serverless functions
- AI or machine learning services
These components allow applications to scale efficiently while remaining resilient and easier to manage.
Common Misconceptions
Many people assume that every software architecture diagram should look the same. In reality, there isn’t a single standard format.
Here are a few common misconceptions:
- “One diagram is enough.” Most systems require multiple diagrams for different audiences and levels of detail.
- “Architecture diagrams replace documentation.” They complement technical documentation but don’t eliminate the need for written explanations.
- “Only architects use them.” Developers, DevOps engineers, testers, security teams, project managers, and even business stakeholders rely on architecture diagrams.
- “Architecture diagrams never change.” They should evolve alongside the software to remain accurate and useful.
Types of Software Architecture Diagrams
No single diagram can explain every aspect of a software system. A solution that works well for executives may not provide enough detail for developers, while a deployment diagram used by DevOps engineers may be too technical for business stakeholders. That’s why experienced software teams create different diagram types, each serving a specific purpose.
Choosing the right diagram depends on the question you’re trying to answer rather than following a one-size-fits-all approach.
System Context Diagram
A System Context Diagram provides the highest-level view of a software application. Instead of focusing on internal components, it shows the system as a whole and its relationship with users and external systems.
This type of diagram is often used during project planning, stakeholder meetings, and business discussions because it clearly defines the system’s boundaries.
A typical System Context Diagram may include:
- End users
- Business partners
- Third-party services
- External APIs
- Payment providers
- Email services
- The software system itself
If someone asks, “What does this application interact with?” this is usually the best diagram to present.
Container Diagram
After understanding the overall system, teams often need to see how the application is divided internally. A Container Diagram answers that question.
Despite the name, “container” doesn’t necessarily mean Docker containers. In the C4 Model, a container refers to an independently deployable application or data store.
Examples include:
- Web application
- Mobile backend
- REST API
- Database
- Authentication service
- Cache server
- Background worker
For many software projects, this is the most frequently used architecture diagram because it balances simplicity with meaningful technical detail.
Component Diagram
When developers need to understand what’s happening inside a service, a Component Diagram becomes useful.
Rather than showing complete applications, it breaks a single service into its major internal modules.
For example, an Order Service might include:
- Order Controller
- Order Validation
- Pricing Engine
- Payment Integration
- Shipping Module
- Notification Module
- Repository Layer
This level of documentation helps development teams understand responsibilities without reading every source file.
Deployment Diagram
A Deployment Diagram focuses on where software actually runs.
Instead of describing application logic, it illustrates infrastructure, including:
- Cloud servers
- Virtual machines
- Docker containers
- Kubernetes clusters
- Databases
- Load balancers
- Firewalls
- Storage services
- Networking components
Deployment diagrams are especially valuable during infrastructure planning, cloud migration, disaster recovery preparation, and DevOps implementation.
Microservices Architecture Diagram
Applications built using microservices often consist of dozens or even hundreds of independently deployable services.
A Microservices Architecture Diagram helps visualize how these services communicate.
It typically includes:
- API Gateway
- User Service
- Product Service
- Inventory Service
- Order Service
- Payment Service
- Notification Service
- Event Broker
- Databases
Instead of one large application, every service performs a specific responsibility while communicating through APIs or messaging systems.
Event-Driven Architecture Diagram
Some applications don’t rely solely on direct API calls. Instead, they communicate through events.
An Event-Driven Architecture Diagram shows:
- Event Producers
- Message Brokers
- Event Streams
- Event Consumers
- Background Workers
This architecture is common in:
- Financial systems
- IoT platforms
- Real-time analytics
- Order processing
- Notification platforms
It improves scalability because services don’t need to wait for one another to finish processing.
Data Flow Diagram
A Data Flow Diagram focuses on information rather than infrastructure.
It illustrates:
- Where data originates
- How data moves
- Where it’s processed
- Where it’s stored
- Which systems consume it
These diagrams are particularly useful for security reviews, compliance audits, and understanding business workflows.
Network Architecture Diagram
While software architects focus on applications, network engineers often require a different perspective.
A Network Architecture Diagram documents:
- Routers
- Switches
- Firewalls
- VPN connections
- Internal networks
- Cloud networking
- Internet gateways
- Security zones
Organizations often maintain these diagrams alongside software architecture documentation.
Comparison of Common Architecture Diagram Types
| Diagram Type | Primary Purpose | Typical Audience |
| System Context | Shows the overall system and external interactions | Business stakeholders, architects, project managers |
| Container | Displays major applications, databases, and services | Developers, architects |
| Component | Explains the internal structure of a service | Development teams |
| Deployment | Documents infrastructure and hosting environments | DevOps engineers, cloud architects |
| Microservices | Illustrates communication between independent services | Architects, backend developers |
| Event-Driven | Shows event producers, consumers, and messaging | Backend developers, system architects |
| Data Flow | Tracks how information moves through the system | Security teams, analysts |
| Network | Documents networking infrastructure | Network engineers, infrastructure teams |
Quick Tip: Start with a System Context Diagram when introducing a project, then move to Container, Component, and Deployment diagrams as more technical detail is needed.
Common Software Architecture Patterns
Architecture patterns provide reusable approaches to solving common software design challenges. Choosing the right pattern depends on factors such as application size, expected traffic, deployment strategy, and maintenance requirements.
Layered Architecture
One of the oldest and most widely used patterns, Layered Architecture organizes an application into logical layers such as presentation, business logic, and data access.
It works well for business applications where responsibilities can be clearly separated.
Best suited for:
- Internal business software
- Enterprise applications
- Traditional web applications
Client-Server Architecture
In this model, client devices send requests while servers process them and return responses.
Most websites, mobile applications, and enterprise systems still rely on this architecture in some form.
Examples include:
- Banking apps
- E-commerce websites
- Customer portals
Monolithic Architecture
A monolithic application packages all functionality into a single deployable unit.
Although often criticized, monoliths remain practical for smaller projects because they are simpler to develop, test, and deploy during the early stages of a product.
Microservices Architecture
Microservices divide an application into independent services that communicate through APIs or messaging.
Benefits include:
- Independent deployments
- Better scalability
- Fault isolation
- Technology flexibility
However, they also introduce operational complexity and require strong monitoring, automation, and DevOps practices.
Event-Driven Architecture
Rather than relying on synchronous requests, services communicate by publishing and consuming events.
This approach is ideal for systems requiring:
- High scalability
- Loose coupling
- Real-time processing
Examples include payment processing, logistics platforms, and IoT systems.
Serverless Architecture
Serverless applications execute code only when needed, allowing cloud providers to manage infrastructure automatically.
Common use cases include:
- Image processing
- Scheduled jobs
- API endpoints
- Notification services
This model reduces infrastructure management but requires careful planning around execution limits and service integrations.
Clean Architecture
Clean Architecture separates business rules from frameworks, databases, and external dependencies.
Because core business logic remains independent, applications become easier to test, maintain, and evolve over time.
Hexagonal Architecture
Also known as Ports and Adapters, this pattern isolates business logic from external systems through clearly defined interfaces.
It is commonly used in applications where flexibility and long-term maintainability are priorities.
How a Software Architecture Diagram Works
Creating an effective architecture diagram isn’t about adding every technical detail. The goal is to communicate the system clearly to its intended audience.
A practical workflow usually looks like this:
Step 1: Define the Scope
Start by deciding what the diagram should explain.
Examples include:
- The entire application
- A single service
- Cloud infrastructure
- Deployment environment
- Security architecture
Keeping the scope focused prevents diagrams from becoming cluttered.
Step 2: Identify Major Components
List the system’s key building blocks, such as:
- Frontend applications
- Backend services
- Databases
- APIs
- Authentication providers
- External integrations
These become the primary elements of the diagram.
Step 3: Show Relationships
Connect components using arrows or labeled lines that indicate:
- Request flow
- Data movement
- Service communication
- Event publishing
- API interactions
Clear relationships make the diagram easier to interpret.
Step 4: Add Infrastructure Details
If the audience requires operational information, include elements such as:
- Cloud providers
- Kubernetes clusters
- Containers
- Load balancers
- Object storage
- CDN services
Infrastructure details should match the diagram’s purpose rather than overwhelm it.
Step 5: Review and Update Regularly
Architecture diagrams should evolve alongside the application.
Whenever major components, integrations, or deployment strategies change, the documentation should be updated so it remains trustworthy.
Real-World Example: Online Retail Platform
Imagine an online retail business serving thousands of customers each day.
A simplified architecture might look like this:
- A customer visits the website or mobile app.
- Requests pass through an API Gateway.
- Authentication verifies the user’s identity.
- The Product Service retrieves catalog information.
- The Inventory Service checks stock availability.
- The Order Service creates the purchase.
- The Payment Service communicates with a third-party payment gateway.
- An event is published to a message broker.
- The Notification Service sends an order confirmation email.
- Monitoring tools record system performance and application logs.
This workflow highlights how multiple independent services cooperate while remaining loosely coupled—an approach commonly used in modern cloud-native applications.
Expert Tips for Better Architecture Diagrams
Small improvements can make diagrams far more useful over time.
- Create separate diagrams for different audiences instead of trying to explain everything in one image.
- Use consistent names, symbols, and icons across all documentation.
- Keep labels descriptive but concise.
- Avoid crossing connector lines wherever possible.
- Include a legend if custom symbols are used.
- Review diagrams during architecture reviews, not just after deployment.
- Treat architecture documentation as part of the development process, not an afterthought.
Benefits of Using a Software Architecture Diagram
A well-designed architecture diagram does more than document a system—it helps teams make better technical decisions throughout the software lifecycle. From planning new features to troubleshooting production issues, a clear visual model reduces confusion and keeps everyone working from the same understanding of the application.
Better Collaboration Across Teams
Modern software projects involve developers, DevOps engineers, QA testers, security specialists, product managers, and business stakeholders. Each group looks at the system from a different perspective.
An architecture diagram provides a common reference that makes technical discussions more productive. Instead of interpreting long documents or reading source code, everyone can discuss the same visual representation.
Faster Onboarding
Joining an existing project can be overwhelming. New developers often spend days or weeks understanding how services interact before making meaningful contributions.
Accurate architecture documentation shortens that learning curve by showing how the application is organized and where each component fits.
Easier Maintenance
As applications grow, dependencies become harder to track. Architecture diagrams help developers identify which services communicate with one another, making updates and debugging less risky.
Better Scalability Planning
Growth rarely happens overnight. A visual overview helps architects identify potential bottlenecks before they become performance problems.
For example, if user traffic increases significantly, diagrams can reveal which services may need load balancing, database replication, caching, or horizontal scaling.
Improved Security Reviews
Security teams often review system boundaries, authentication flows, external integrations, and sensitive data movement.
Architecture diagrams make these reviews more efficient because important trust boundaries and communication paths are visible at a glance.
Pros and Cons
| Pros | Cons |
| Improves communication between technical and non-technical teams | Can become outdated if not maintained |
| Simplifies complex systems | Large systems may require multiple diagrams |
| Supports scalability planning | Creating detailed diagrams takes time |
| Speeds up onboarding | Too much detail can reduce readability |
| Helps with troubleshooting | Different teams may use inconsistent notation |
| Assists compliance and security reviews | Requires regular updates as systems evolve |
Best Practices for Creating Effective Architecture Diagrams
Creating an architecture diagram isn’t about fitting every technical detail onto one page. The most useful diagrams communicate only the information their audience needs.
Start With the Right Level of Detail
A common mistake is trying to create one diagram that explains everything.
Instead, create separate diagrams for different audiences.
For example:
- Executives may only need a high-level system overview.
- Developers often require component-level documentation.
- DevOps teams usually focus on deployment and infrastructure.
Keeping each diagram focused makes it far easier to understand.
Use Consistent Naming
Component names should match the terminology used throughout the project.
If documentation refers to a service as the “Order Service,” avoid calling it the “Purchase Module” elsewhere. Consistency reduces confusion.
Keep the Layout Clean
Arrange related components together and avoid unnecessary crossing lines. A clean layout makes the relationships between services much easier to follow.
Show Only Meaningful Relationships
Not every internal connection needs to appear in a diagram.
Highlight only the communication paths that help explain how the system works.
Review Documentation Regularly
Architecture diagrams lose value when they no longer reflect the actual system.
Many teams include documentation updates as part of their development workflow so diagrams remain accurate after each significant architectural change.
Common Mistakes to Avoid
Even experienced teams occasionally create diagrams that are difficult to interpret.
Some of the most common mistakes include:
Including Too Much Detail
Trying to document every class, method, and database field often results in diagrams that are impossible to read.
Focus on the level of abstraction that matches the diagram’s purpose.
Mixing Different Views
Logical architecture and deployment architecture answer different questions.
Combining both into a single diagram usually creates unnecessary complexity.
Ignoring External Systems
Applications rarely operate in isolation.
Payment providers, identity platforms, cloud storage, analytics services, and third-party APIs should appear when they play an important role.
Using Inconsistent Symbols
Choose a consistent visual style across all diagrams.
Switching symbols, colors, or naming conventions from one document to another makes documentation harder to understand.
Forgetting to Update Documentation
Outdated diagrams can be more misleading than having no diagrams at all.
If the system changes, the architecture documentation should change with it.
Modern Trends in Software Architecture
Software architecture continues to evolve as development practices change. Several trends are shaping how teams design and document applications today.
Cloud-Native Architecture
Many organizations now build applications specifically for cloud environments rather than adapting traditional software later.
Cloud-native systems typically use:
- Managed cloud services
- Auto-scaling infrastructure
- Distributed storage
- API-first communication
- Containers
Architecture diagrams increasingly reflect these distributed environments instead of single-server deployments.
Kubernetes and Containerized Applications
Kubernetes has become a common platform for managing containerized workloads.
Instead of documenting individual servers, many architecture diagrams now show:
- Kubernetes clusters
- Pods
- Services
- Ingress controllers
- Persistent storage
- Container registries
This provides operations teams with a clearer picture of application deployment.
Diagram-as-Code
Keeping diagrams synchronized with software documentation has always been challenging.
Diagram-as-Code tools solve part of this problem by allowing diagrams to be generated from text-based definitions stored alongside application code.
Popular approaches include:
- Mermaid
- PlantUML
- Structurizr DSL
Because these files live in version control, teams can review architecture changes just like source code.
AI-Assisted Software Design
Artificial intelligence is beginning to support software architecture by helping teams:
- Generate initial architecture drafts
- Analyze dependencies
- Suggest documentation improvements
- Identify missing relationships
- Visualize existing codebases
While these tools can speed up documentation, architectural decisions still require human judgment, especially for security, scalability, compliance, and long-term maintainability.
Choosing the Right Architecture Diagram
Not every project requires every diagram type.
The right choice depends on the question you’re trying to answer.
| If you want to… | Use this diagram |
| Explain the overall system | System Context Diagram |
| Show applications and databases | Container Diagram |
| Document internal modules | Component Diagram |
| Explain infrastructure | Deployment Diagram |
| Visualize service communication | Microservices Diagram |
| Track information movement | Data Flow Diagram |
| Document networking | Network Architecture Diagram |
A good rule of thumb is to start with the simplest view that answers the reader’s question. If additional detail is needed, create another diagram rather than overcrowding the first one.
Frequently Overlooked Considerations
Many architecture discussions focus on services and databases but overlook operational concerns that become critical in production.
When documenting larger systems, consider including:
- Authentication and authorization boundaries
- Monitoring and alerting platforms
- Logging infrastructure
- Backup and disaster recovery components
- Rate limiting
- Content Delivery Networks (CDNs)
- Secrets management
- Message brokers
- Caching layers
- External dependencies
Including these elements provides a more complete picture of how the system operates in real-world environments.
Key Takeaways
Before creating or reviewing an architecture diagram, remember these principles:
- Keep diagrams focused on a specific audience.
- Use multiple diagrams instead of one oversized diagram.
- Maintain consistent terminology and symbols.
- Update documentation whenever the architecture changes.
- Include only meaningful relationships and dependencies.
- Treat architecture documentation as part of the software development lifecycle, not as a one-time task.
Conclusion
A software architecture diagram is far more than a technical drawing—it’s a communication tool that helps teams design, build, and maintain software with greater confidence. By showing how components interact, where data flows, and how infrastructure supports the application, it gives everyone involved a shared understanding of the system.
The most effective diagrams are clear, current, and tailored to their audience. Whether you’re documenting a simple web application, a cloud-native platform running on Kubernetes, or a large microservices ecosystem, thoughtful architecture documentation can reduce complexity, improve collaboration, and support better technical decisions throughout the life of the project.
As software continues to evolve, keeping architecture diagrams accurate and aligned with the system will remain an essential practice for development teams of every size.
FAQs
What is the purpose of a software architecture diagram?
Its primary purpose is to show the structure of a software system, explain how major components interact, and improve communication among technical and business stakeholders.
Is a software architecture diagram the same as a UML diagram?
No. A software architecture diagram provides a broader view of the system’s structure, while UML diagrams typically focus on specific aspects such as classes, sequences, or object interactions.
Which diagram should I create first?
Most projects begin with a System Context Diagram because it establishes the application’s scope and external interactions. Additional diagrams can then provide more technical detail.
How often should architecture diagrams be updated?
Update them whenever significant architectural changes occur, such as adding new services, changing infrastructure, or introducing major integrations. Keeping documentation current is essential for its long-term value.
What are the best tools for creating software architecture diagrams?
Popular choices include diagrams.net (Draw.io), Lucidchart, Microsoft Visio, PlantUML, Mermaid, Visual Paradigm, and Structurizr. The best option depends on your team’s workflow, collaboration needs, and documentation practices.